Graphs
Our data simplified
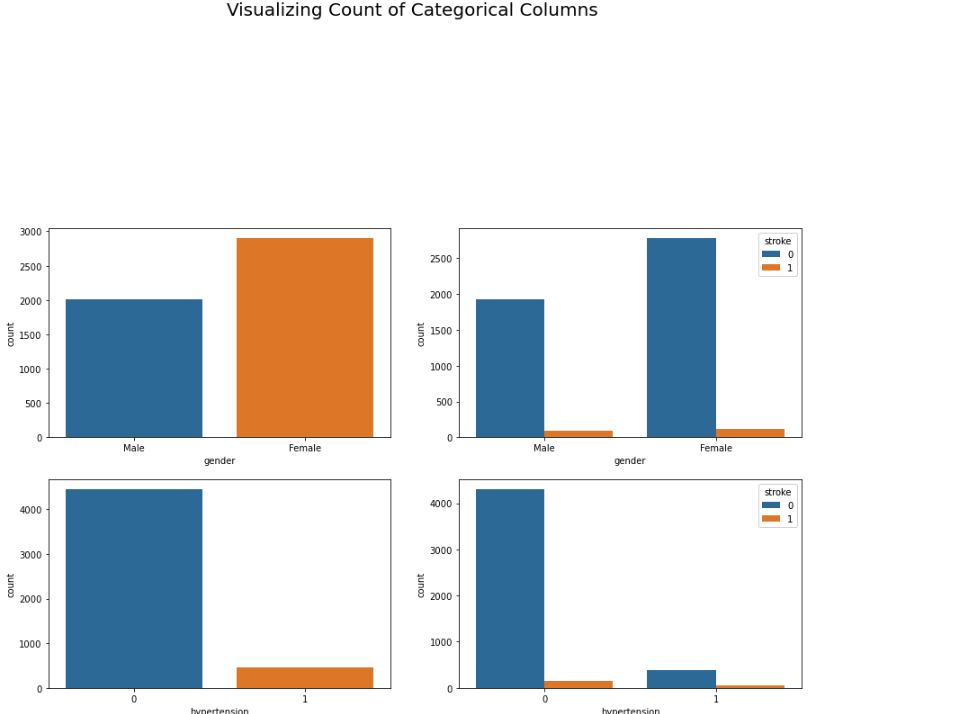
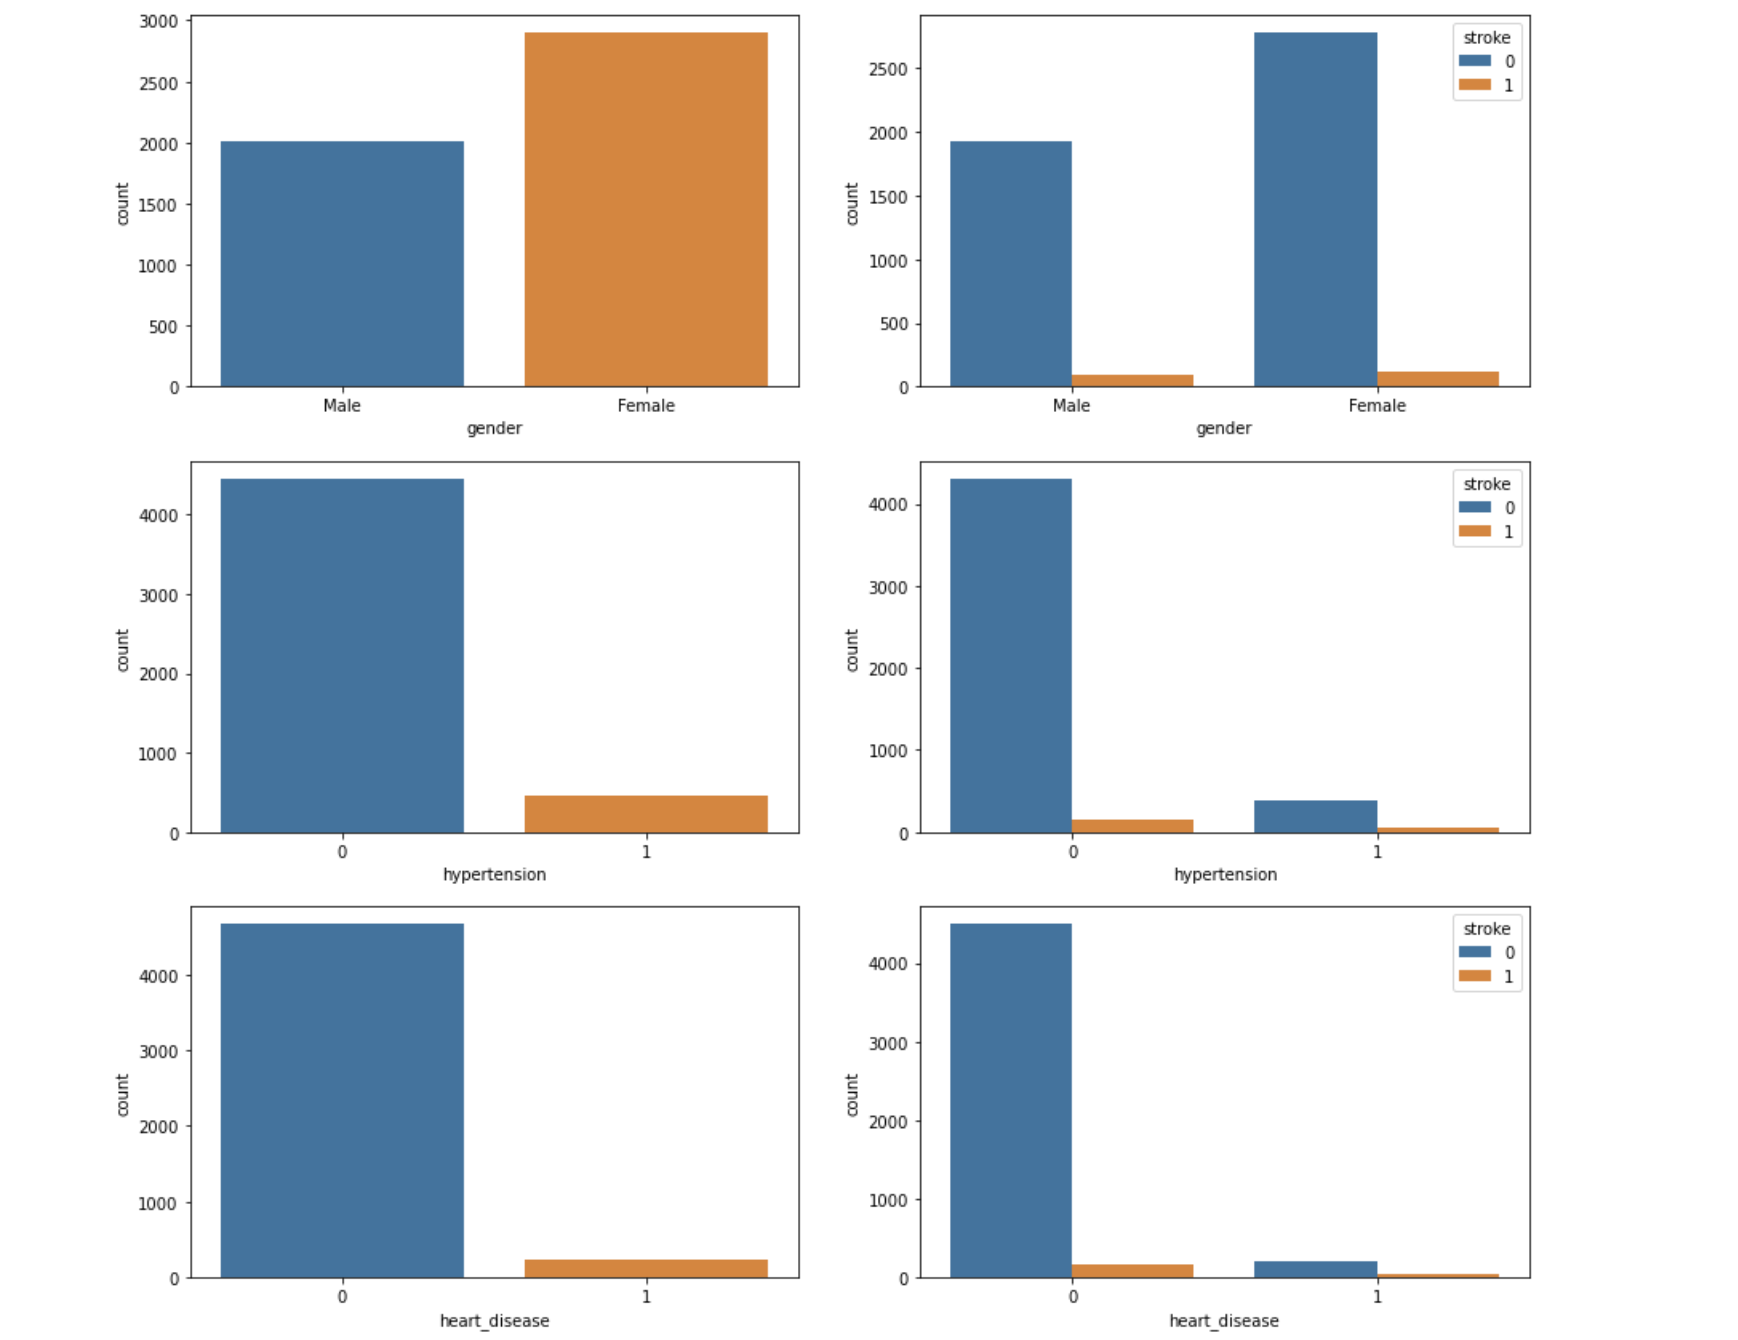
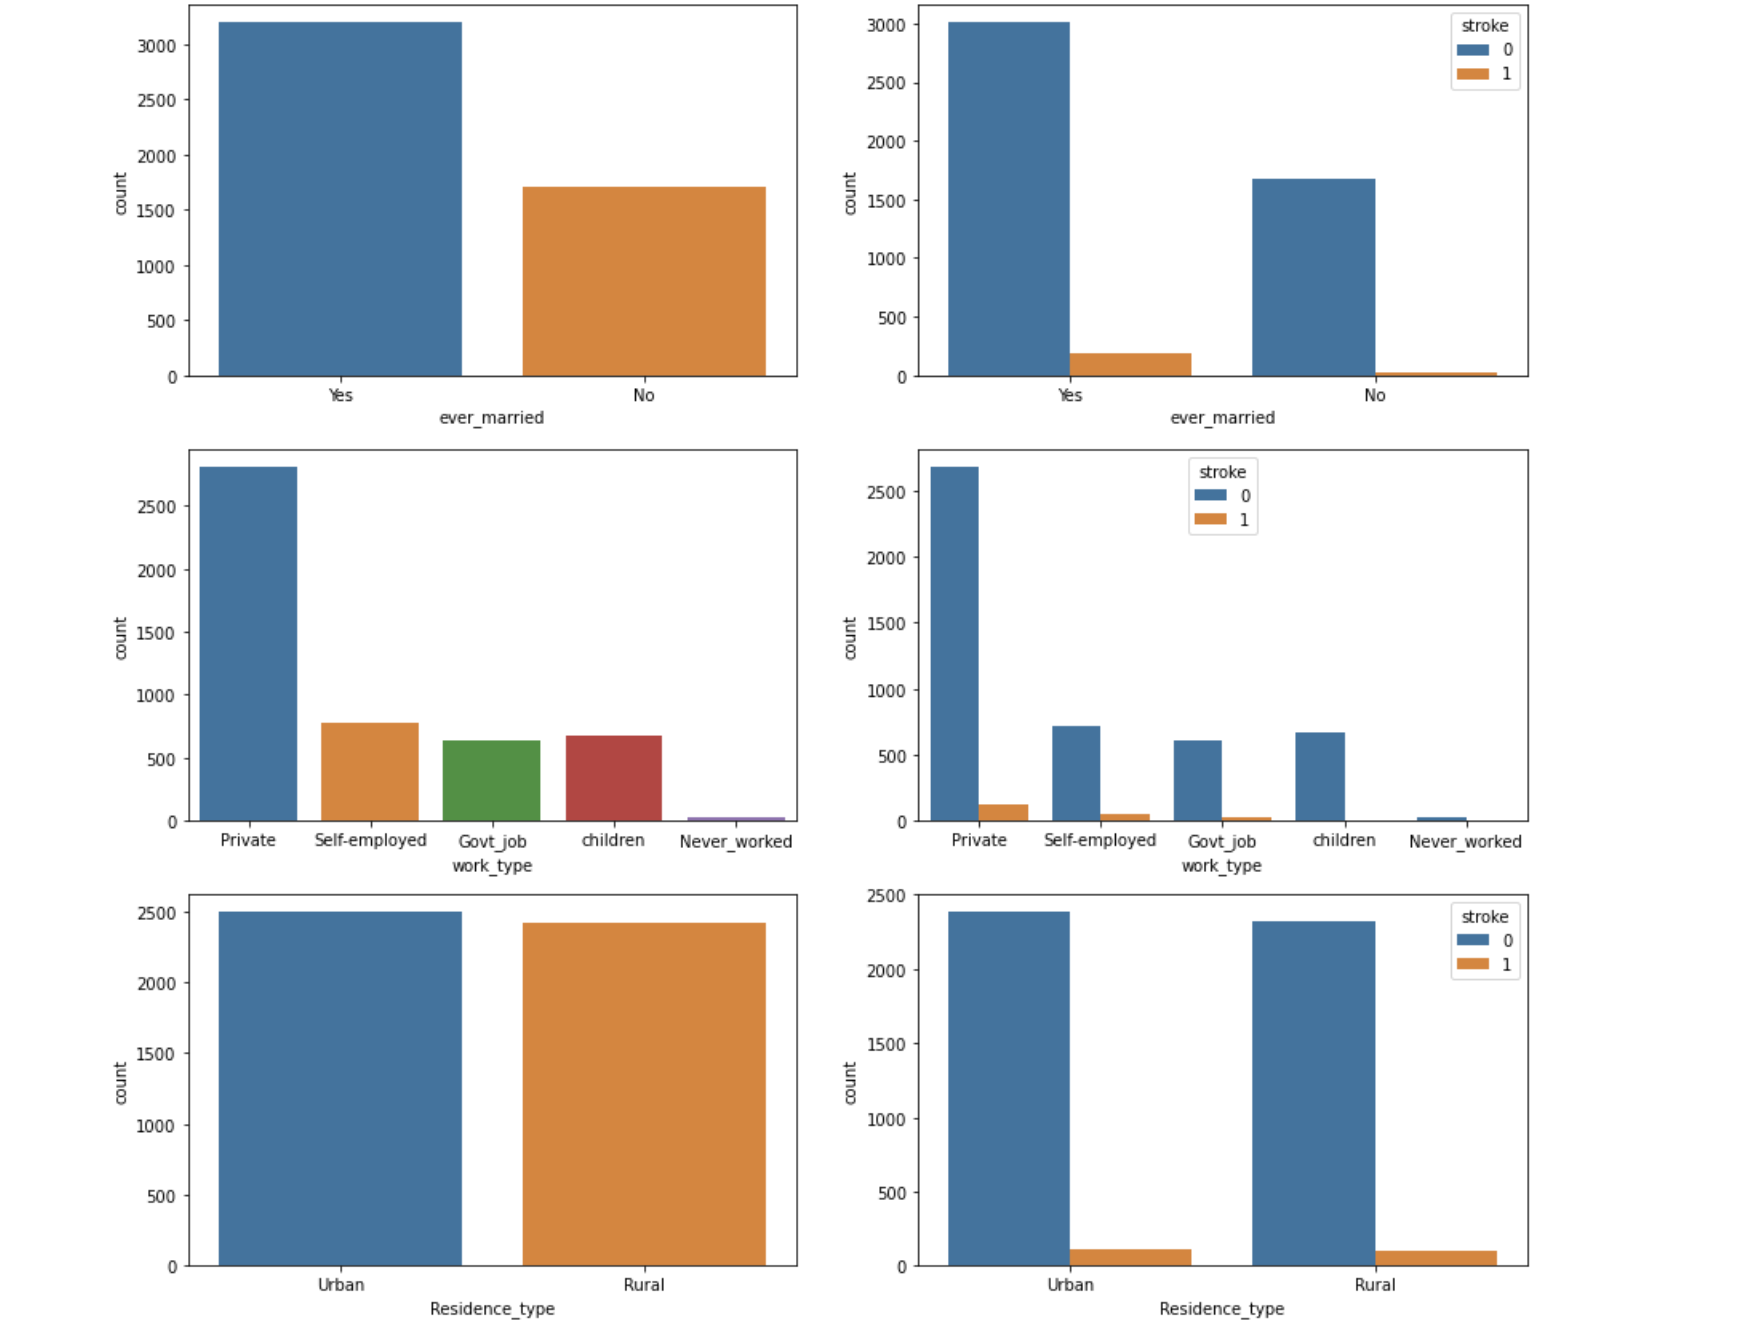
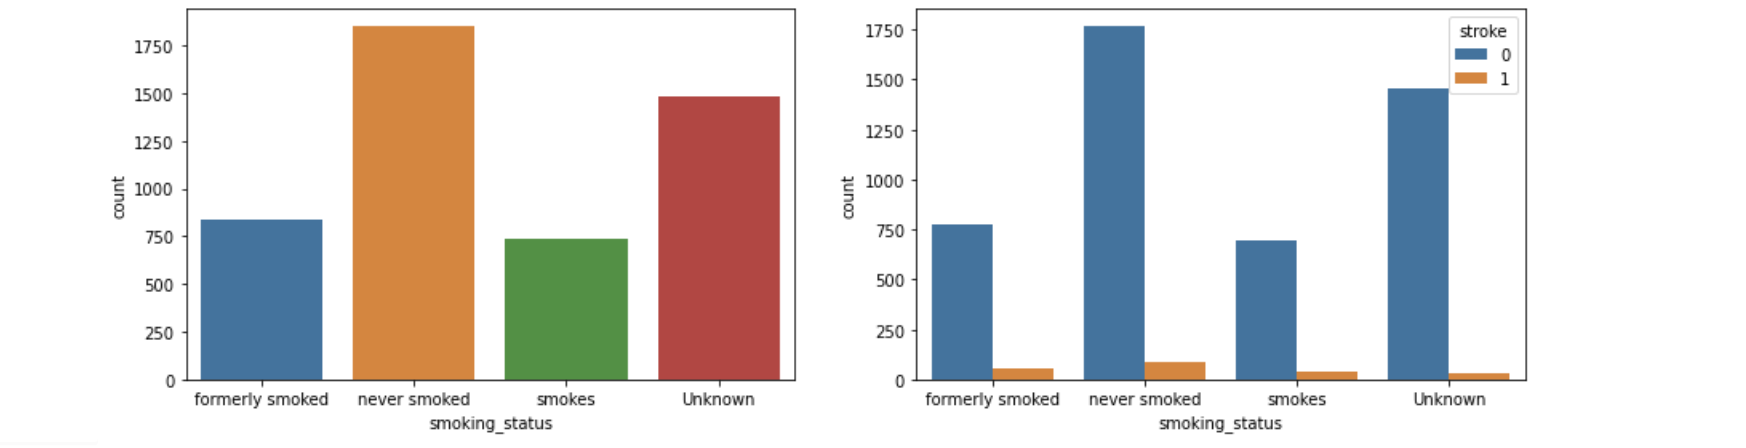
Visualizing Count of Categorical Columns
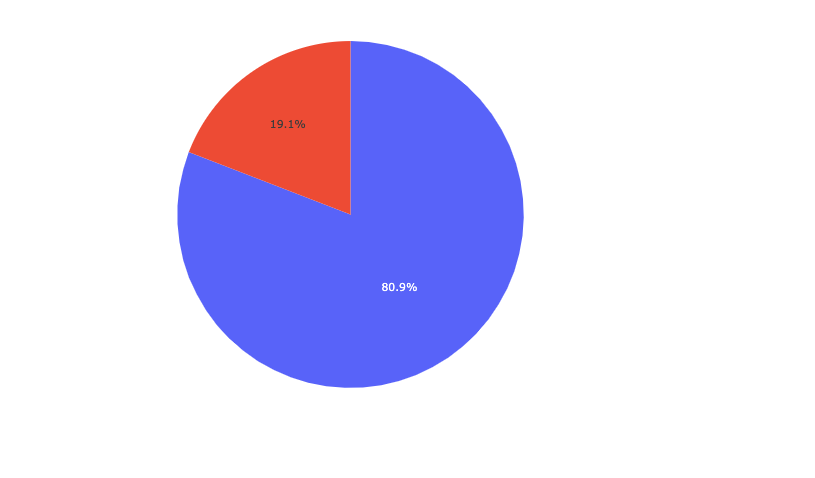
Pie Chart
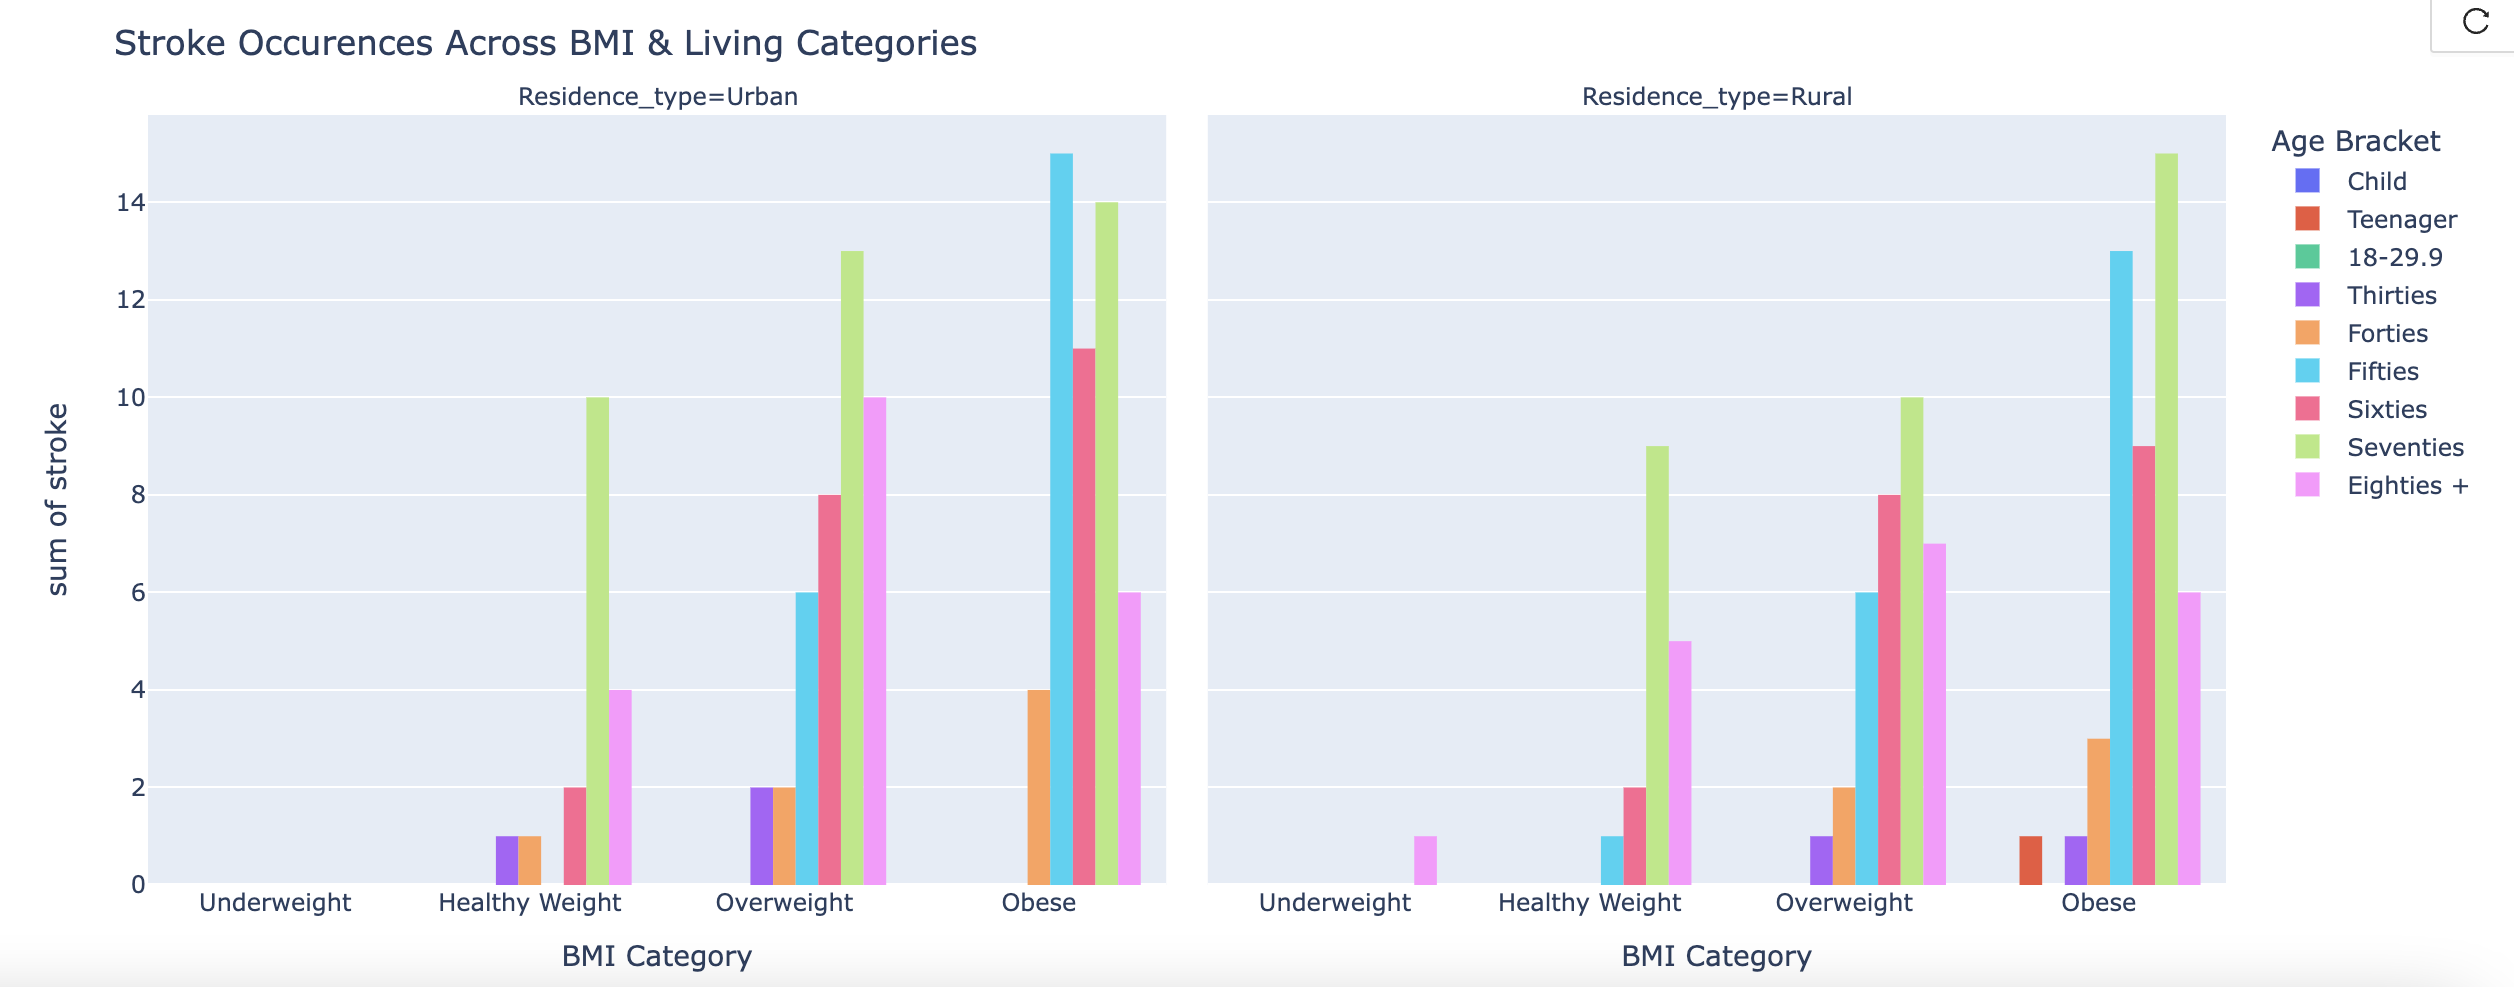
Dual Bar Graph
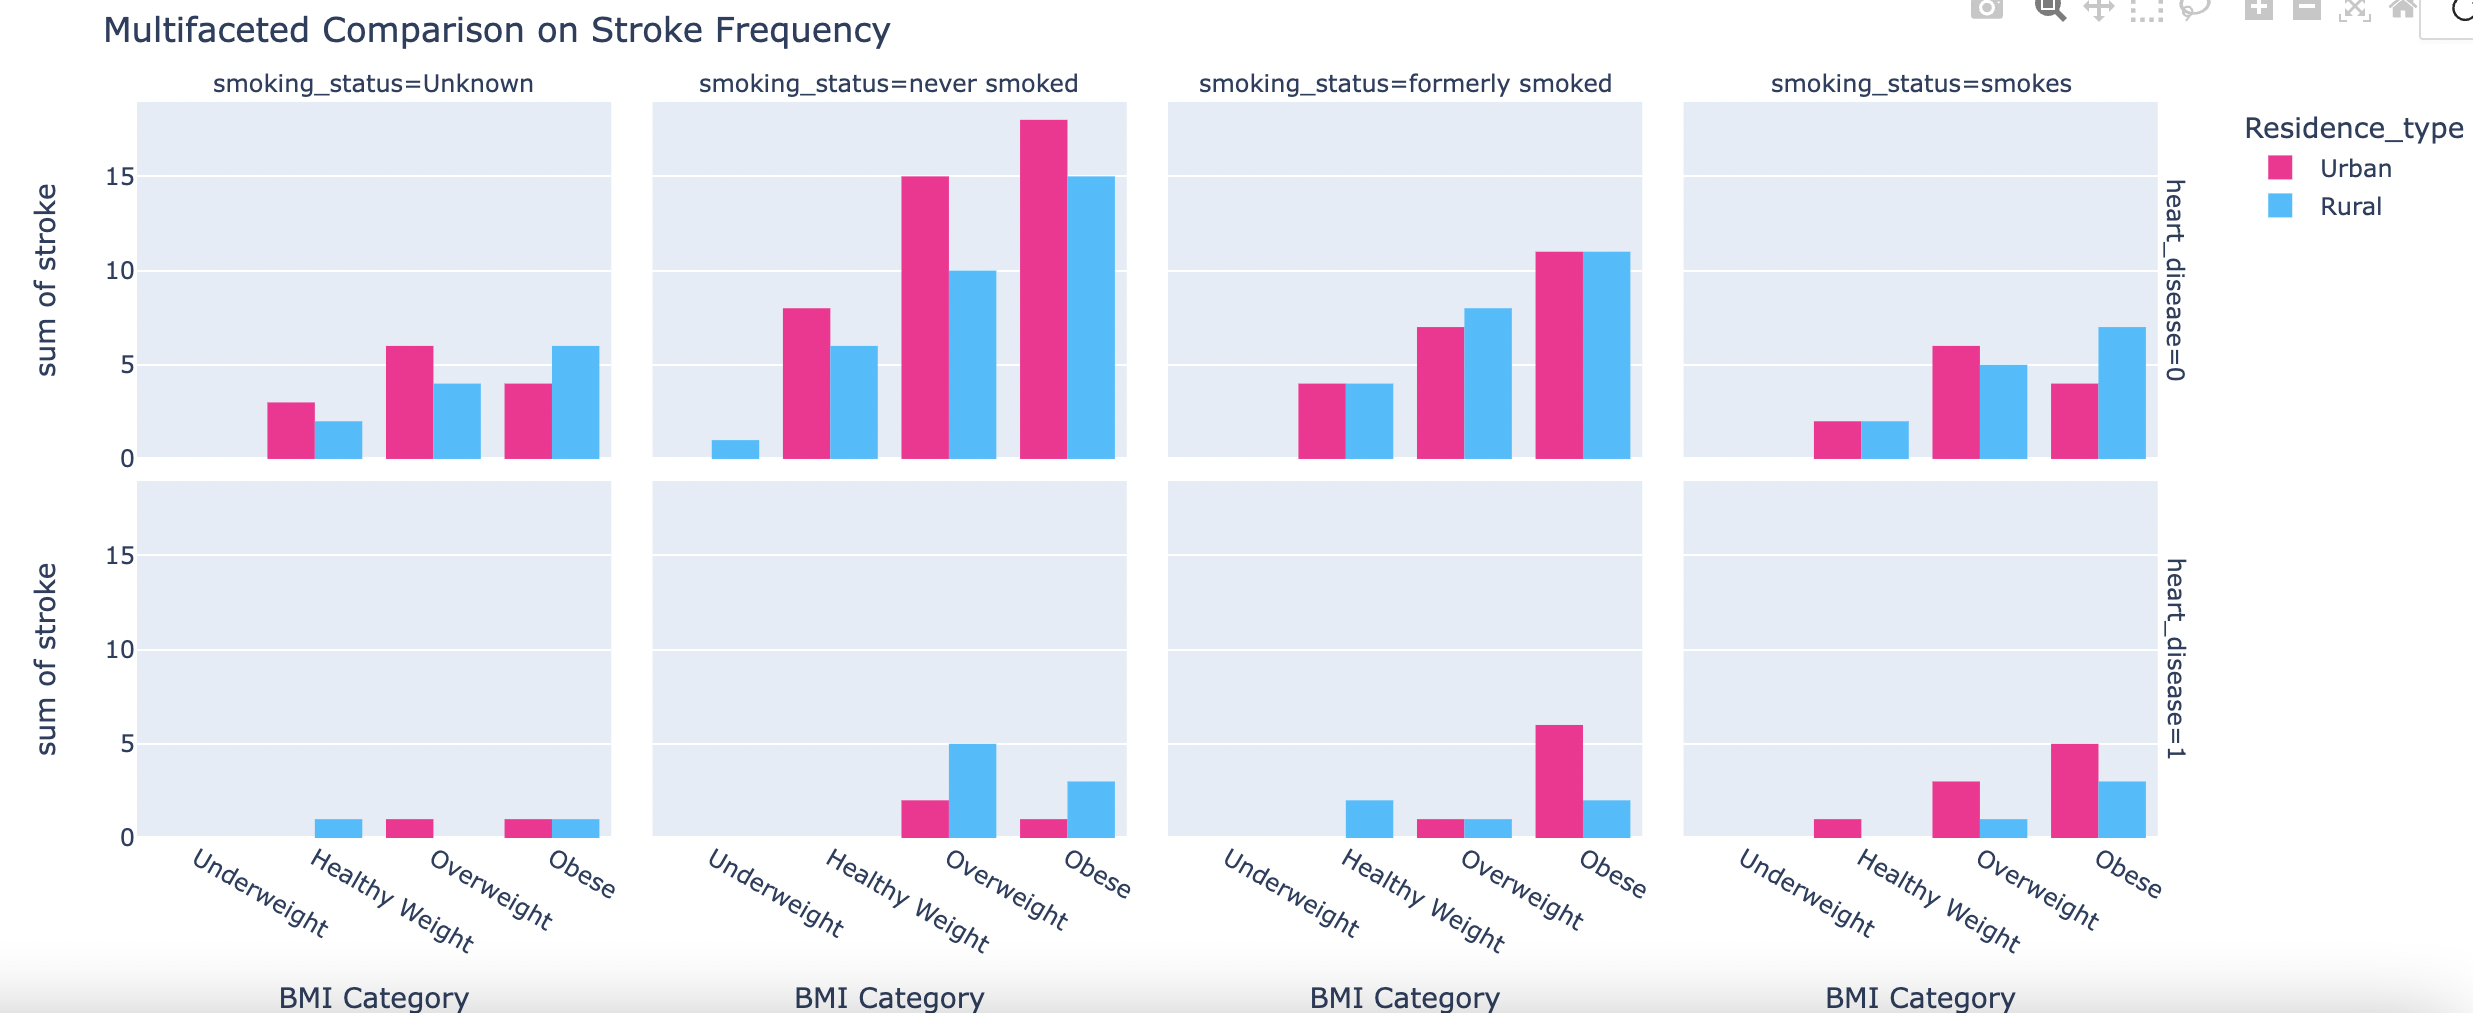
Multifaceted Bar Graphs
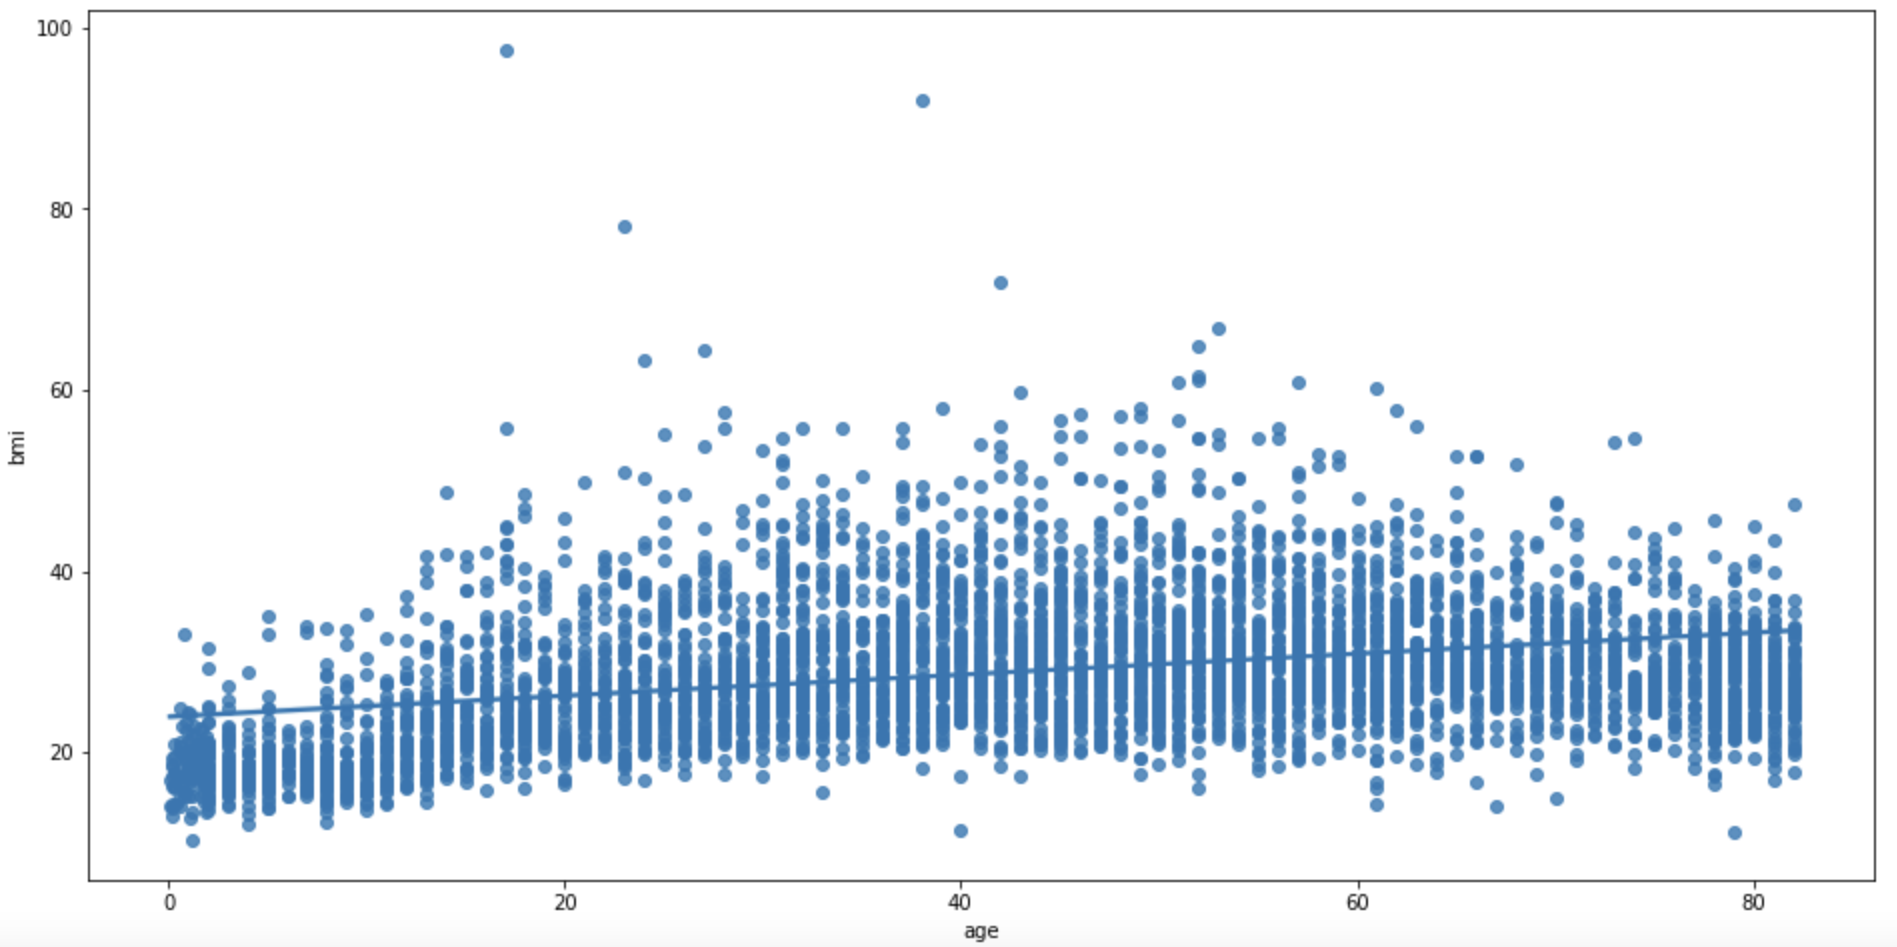
Scatter Plot
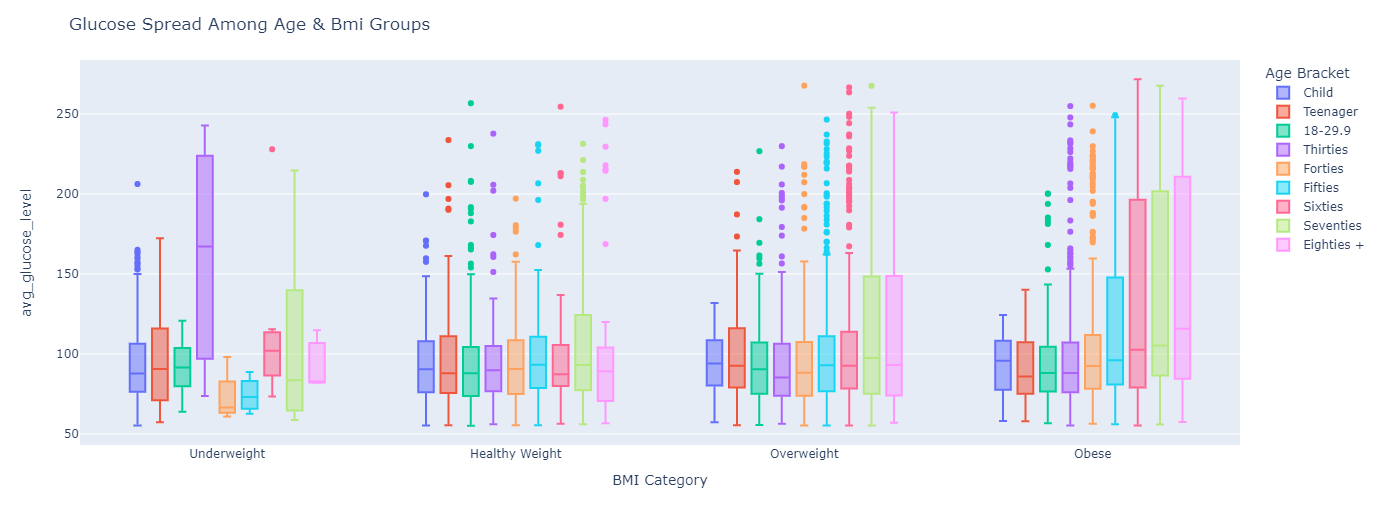
Box Plot
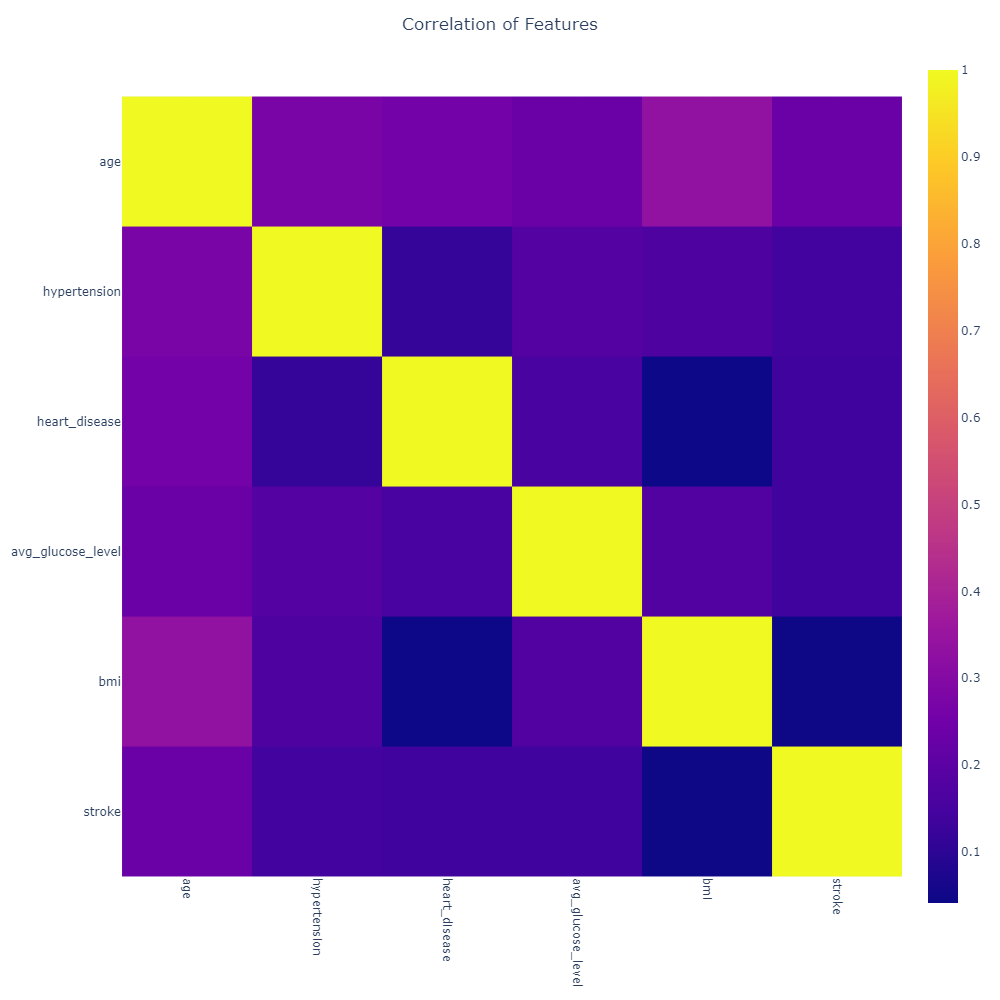
Correlation Heatmap
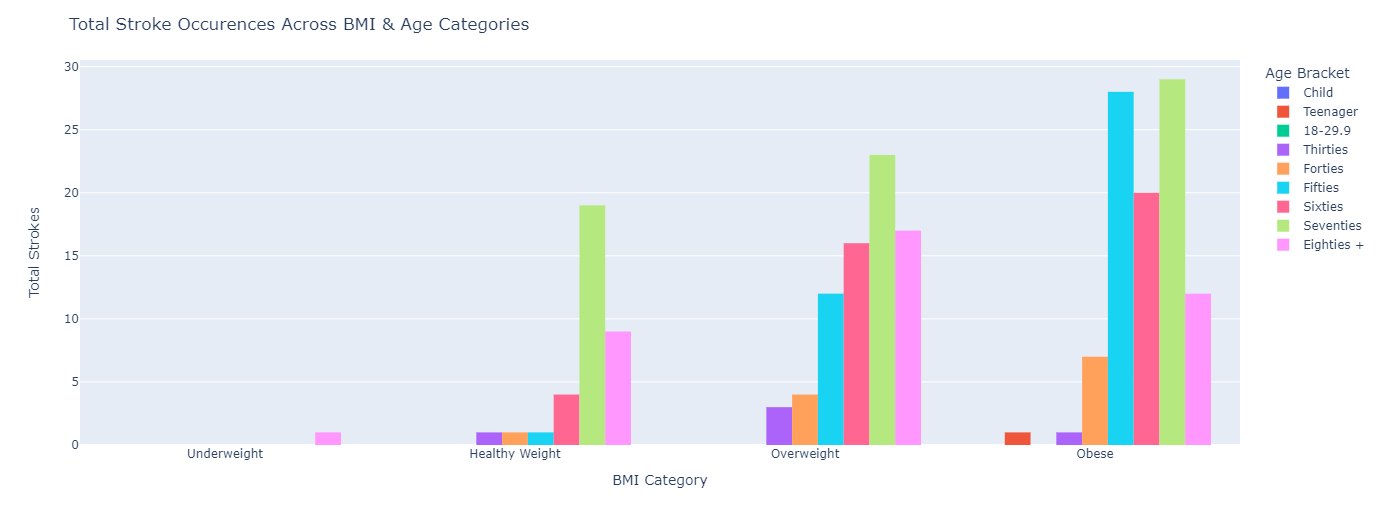
Clustered Bar Graph